If you’ve ever taken a look at the back of our coffee bags you will have noticed a list of coffee recipes or ‘brewing ratios’. Where filter brewing is concerned we recommend a ratio of 30g of coffee to 500ml of water or 60g per litre. Have we plucked this figure out of mid air? Does it just apply to our coffee? How did we decide on this ratio?
To understand the reasoning behind this ratio of coffee to water we need to understand a little bit more about the science behind coffee brewing – it gets a bit geeky from here on in! Specifically we need to know a little bit about two characteristics of coffee – strength and extraction.
Strength is relatively easy to define and explain. It is the percentage of dissolved solids in your cup of coffee. Your brew is made up of water and dissolved coffee solids. In brewed coffees, for example, we would typically be looking at a strength range between 1.0 and 1.6%. A coffee with a 1.0% strength would be 99% water to 1% dissolved coffee solids. A 1.6% coffee would be 98.4% water to 1.6% solids.
Some coffees are also made up of suspended solids. Both cafetiere brewed coffee and espresso include suspended solids but we only judge strength by the percentage of dissolved solids. Though we won’t be referring to espresso much in this article, it is worth noting that the espresso strength range is around 8-12%, so around 90% water to 10% dissolved coffee solids.

Hopefully that is pretty straight forward so far! Extraction is a little more complex and it doesn’t help that both strength and extraction are defined as a percentage. Extraction is everything that water takes from coffee (credit to Barista Hustle for this elegant way of defining extraction)
Take the ground coffee you are going to use for your next brew. In a perfect world we could dissolve around 30% of the grounds into water with the rest being insoluble plant fibres and cellulose. In this perfect world, brewing coffee would be easy! You would simply extract all the soluble solids into your cup (around 30%) and throw the rest away as the spent coffee grounds (70%).
Alas nothing is that easy! Some of that 30% doesn’t taste great! It adds an aftertaste to the coffee which is bitter, drying and dominates the cup. The art, the skill, the science (call it what you want) to brewing coffee is all about controlling extraction. Dissolve enough of the good solids to make a delicious coffee, while making sure you don’t dissolve any of the bad stuff.
That brings us back to those all important brewing ratios. We can express the relationship between strength and extraction on a brewing control chart, pictured below. The vertical axis relates to strength (in this case the range for brewed coffee and not espresso). Strength is a personal thing so the range is large. The difference in strength between a 0.9% coffee and a 1.8% coffee is vast.
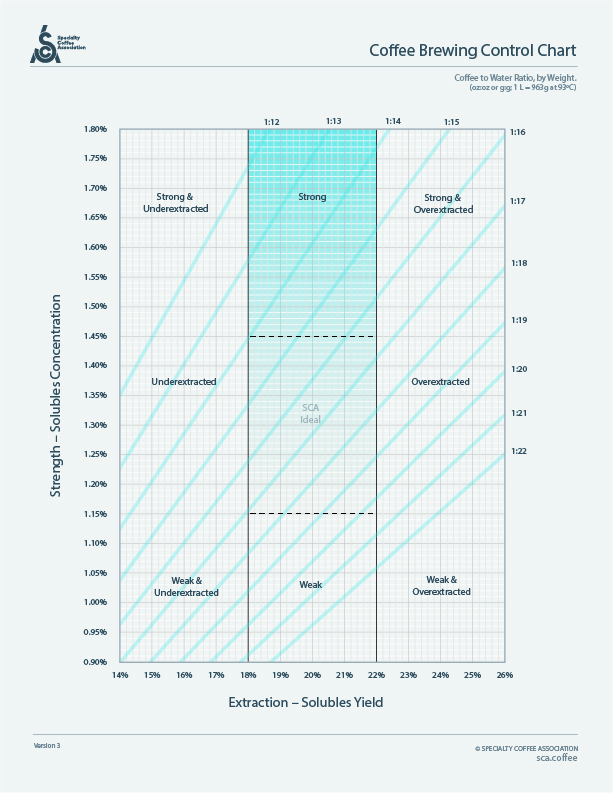
The horizontal axis refers to extraction and this is where it becomes interesting. Regardless of the coffee you brew and regardless of the brewing method used, there is an extraction range where the coffee will taste best: 18-22%. On a day to day basis I try to brew my coffee in the 19-20% range, regardless of the brewing method I use.
If we underextract our coffee, in other words we leave too much of the good stuff in the grounds, our brew can taste sharp and sour, it lacks sweetness and there is no finish or aftertaste. This equates to an extraction figure of less than 18% On the other hand if we overextract our coffee we have dissolved those bad solids into the cup and the brew will be bitter, dry and astringent. This equates to an extraction figure above 22%. In that middle range the coffee will be sweet, it will have a complex acidity, there will be mouthfeel and a lingering, pleasing finish.
The brewing control chart has been divided into zones and the one labelled ‘SCA Ideal’ is of interest to us initially. The lower strength limit of 1.15% and upper strength limit of 1.45% represent a range which most people find ideal. I personally like my coffee in the 1.2 to 1.3% range.
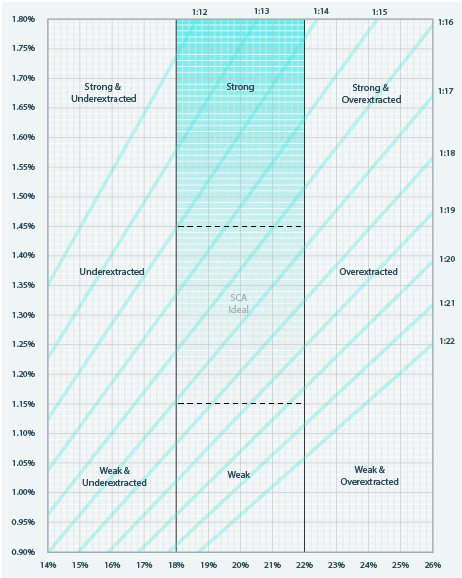
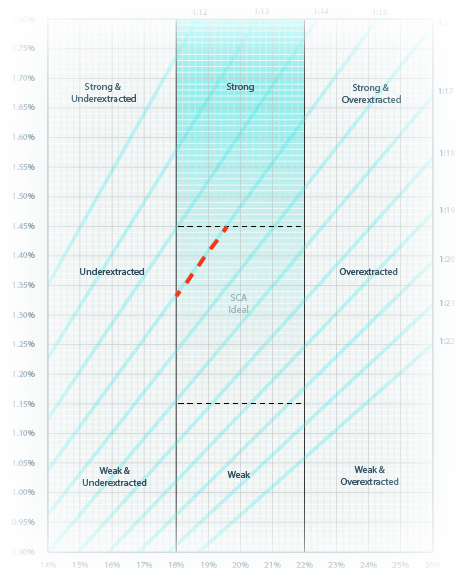
Now consider the blue diagonal lines which intersect this ideal range. Each line represents a specific brew ratio. The 1:16 line relates to a ratio of 62.5g coffee to 1 litre of water while the 1:17 line represents 58.8g coffee to 1 litre water. Those two lines follow the main diagonal of the ideal zone and therefore these ratios will give us the best chance of brewing coffee in the ideal zone. In other words by choosing either of those ratios we maximise our opportunity of brewing a coffee in the sweet spot.

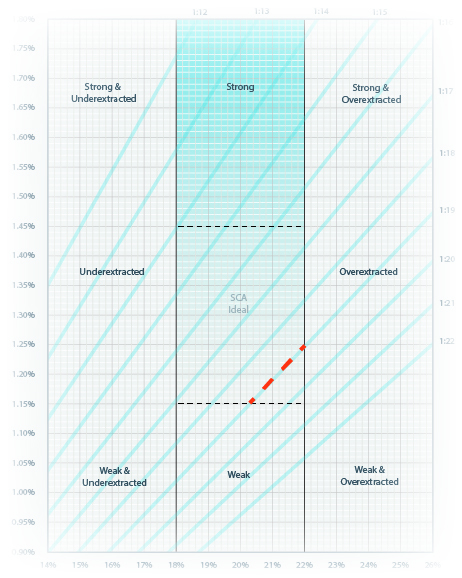
Had we been a little mean with the amount of ground coffee used and opted for a 1:19 ratio (52g per litre), we would have made it harder to brew a coffee in the ideal zone, as the 1:19 line barely intersects the ideal zone.
Similarly a 1:15 ratio (66.6g per litre) again reduces our chances of brewing in that ideal zone.
Those figures of 62.5g per litre and 58.8g per litre are not so easy to deal with mathematically so we tend to aim for 60g coffee to every litre of water, 30g to half a litre or 15g to quarter of a litre. You get the idea!
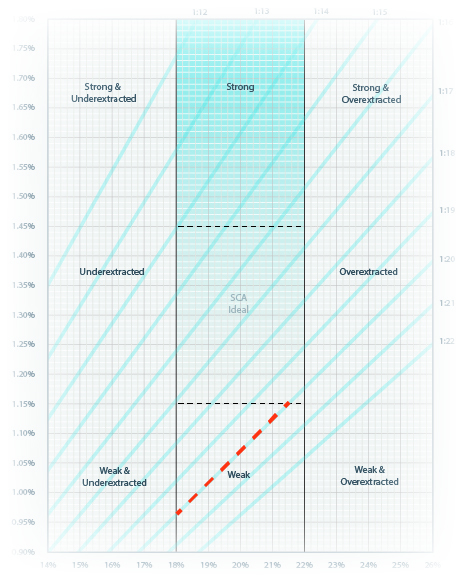
Now you might enjoy your coffee outside the ideal range and the brewing control chart can also help in that respect. If you like your coffee strong you might like to use a ratio of 1:14 , or around 70g per litre, as that line intersects the main diagonal of the strong range. Similarly a 50g per litre ratio might be best for those who enjoy their coffee weaker.

Where your brew actually lands in these zones will depend upon a number of factors including the grind, the brew time, the water temperature, water quality and even technique. For example, a longer brewing time will increase extraction while a shorter brew time will decrease extraction. Similarly a finer grind will likely speed up extraction for a given time. Technique can also make a big difference to controlling extraction which is we have a selection of brewing videos on our YouTube channel.
The decisions we make and advice we give at Carvetii are more than just our opinion. They are based upon research and learning more than anything else, along with years of interpreting that knowledge in the real world. So when we give recipe advice on our coffee bags, or any advice for that matter, it really is there to help you produce the best possible brew.
Comments are closed.